Navigating the Uber Experience:
A UX Case Study for New and Frequent Users


Project Overview:
The purpose of this case study was to conduct a usability evaluation of the Uber app, specifically focusing on the experiences of new and frequent users. Given Uber's dual functionality as both a ride-hailing and food delivery service, our goal was to explore how intuitive and seamless the app experience was for different user types. We focused on users’ onboarding, task flows, and overall ease of use, with insights collected to suggest improvements that enhance user satisfaction.
Why Uber?
We decided to evaluate the Uber app because it’s such a big part of how people get around and order food in their daily lives. Our goal was to dive into user experiences, pinpoint what works well, and identify areas that could use improvement. As product designers, we’re really curious about how apps like Uber strike a balance between functionality and user engagement in a competitive landscape. This evaluation gives us the chance to apply our design skills and gather valuable insights for future user-centered designs.
Role
UX Researcher & Analyst
Team
Shraddha - me;)
Ariel
Shubhangi
Vivek
Duration
6 weeks
Research Goals:
The core objective of this study was to understand the Uber app experience for new and frequent users across multiple interactions. We aimed to answer the following questions:
New Users:
To understand the onboarding experience
Explore how new users perceive the sign-up and first ride processes
Are they easily able to navigate and use the app?
Identify any confusion, challenges, or technical issues that new users face
What might encourage them to continue using Uber
Discover why new users choose Uber for their first ride
Frequent Users:
Explore how users feel about the app’s functionality over time
What features keep them engaged?
Understand how users adapt to and perceive changes
Are these changes seen as improvements or obstacles?
How users respond to personalized features, ride suggestions and promotions.
What motivates them to stick with Uber?

Research Methodology
The core objective of this study was to understand the Uber app experience for new and frequent users across multiple interactions. We aimed to answer the following questions:
User Interviews
Getting the Real Story from Real Users

Think-Aloud Sessions
Observing Users in Real Time


SUS Assessment
Calculating System Usability Scale Scores


Target Participants
To truly understand how people engage with Uber, we started by talking to them directly. Our goal was to capture the range of experiences—from those who are opening the app for the first time to regular users who rely on Uber daily. We recruited
8 participants representing both new & frequent users. We conducted interviews with two groups:
New Users:
People who have just started using the Uber application, and are relatively new to the experience of booking rides/ ordering food from Uber. (Experience Level <= 2 months)
Why they were chosen?
New Users offer a fresh perspective on the app. They can specify any challenges they face in the beginning during the onboarding stages & during their initial experience with the app.

Frequent Users:
People who have moderate experience with the application i.e people who often book rides/ order food using Uber.
Why they were chosen?
Frequent Users who’ve used the app for quite some time, would know how the app works and can point out the good and bad aspects of it. They can also highlight what exactly makes them use the app more often.
Phase 1:
User Interviews
Interview Outline
We asked about the frequency with which they used the app, any specific rides or food orders they remembered, and what features they loved or wished were different. We collected data in two ways: we took notes and also recorded audio (with participants’ permission), which we later transcribed. This process allowed us to capture users’ exact words, making it easier to identify recurring themes and insights.
Background
How often do you use apps to book rides or have food delivered?
How long have you been using apps like Uber?
Uber Usage
How frequently do you use Uber for rides or food delivery?
Is Uber your preferred app? Why or why not?
What do you like and dislike about using Uber?
How does Uber compare to other services (like Lyft or DoorDash)?
First-Time Experience
How did you hear about Uber, and what led you to try it?
Was the onboarding process easy or challenging?
Did you face any difficulties during your first use?
Were the tracking and safety features useful?
General Experience
Have you encountered issues (e.g., delays, app glitches)?
How was Uber’s support in resolving these issues?
Do you feel safe using Uber, and do you trust the ratings?
What would bring you back to Uber? Any features you’d like to see?
Closing
Thank you for sharing your thoughts! Is there anything else you'd like to add?

Analysis Process
The analysis followed a structured process using affinity diagrams to categorize and visualize user feedback. After transcribing interviews, key themes, pain points, and opportunities were identified. This analysis focused on pain points, what works well, likes and dislikes, and user satisfaction.
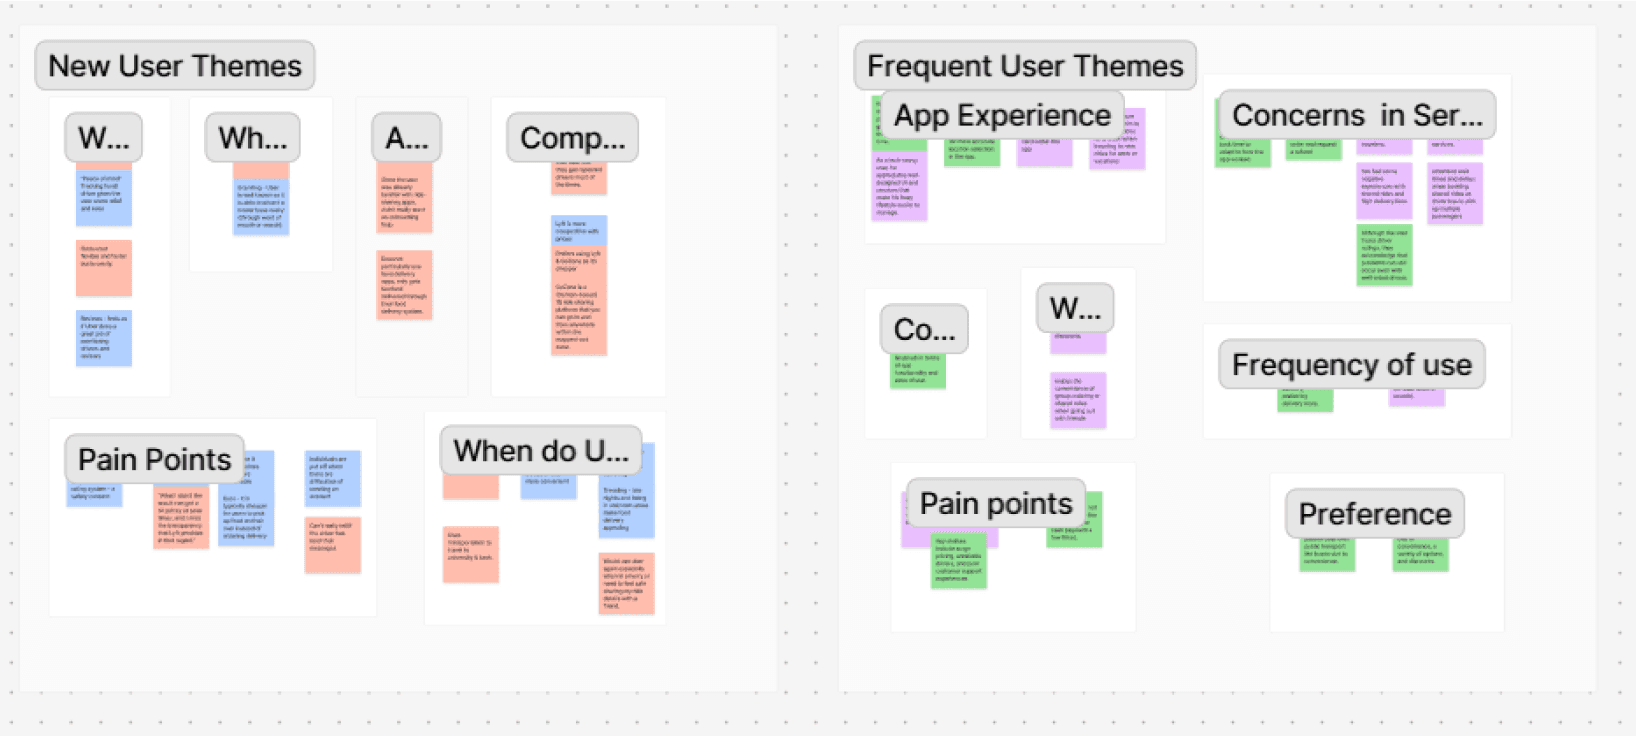
Affinity Mapping
This stage helped us identify the most common issues and pinpoint the specific features that users wanted to be enhanced. It also confirmed a clear distinction between the needs of new and frequent users, which guided our next steps.

1
2
User Personas
The analysis followed a structured process using affinity diagrams to categorize and visualize user feedback. After transcribing interviews, key themes, pain points, and opportunities were identified. This analysis focused on pain points, what works well, likes and dislikes, and user satisfaction.
New User

Alex Martinez
Role
Computer Science, Undergrad
Location
Denton, TX
Age
23
Bio
Alex is a budget-conscious postgraduate student who uses transportation apps to commute between his apartment and university. He’s new to Uber, cautious about spending, and seeks affordable, reliable rides for his daily needs.
Goals
To find a reliable, quick, and affordable ride-sharing service for daily commuting.
Use reide-hailing apps for reliable transportation to campus, especially during rush hours.
To feel safe while traveling alone.
Frustrations
Finds Uber more expensive compared to its competitors, especially with surge pricing.
Frustrated with Uber's cancellation fee on the next ride.
Often unsure if drivers see his messages when contacting them through the app.
Needs
Transparent pricing and budget-friendly options.
Since Alex commutes daily and runs errands, he needs a service that provides dependable rides
He needs a more transparent way of knowing whether his messages to drivers have been delivered and read.
Frequent User

Sarah Gomez
Role
Business Analytics
Graduate Student
Location
Indianapolis, IN
Age
21
Bio
Sarah, a young professional in a busy city, relies on Uber for both rides and food delivery. After trying other apps, she prefers Uber for its ease of use, promotions, and features like real-time tracking and safety options, which make her feel secure.
Goals
Maintain a seamless, reliable transportation and food delivery experience.
Feel safe and secure when traveling, especially at night or in unfamiliar areas.
Enjoy cost-effective options and promotions
Frustrations
High prices or surge pricing during busy times, which affect her budget.
Occasional delays or cancellations that disrupt her tight schedule.
Limited availability of rides or promotions when needed most.
Needs
An easy-to-use app with clear tracking and dependable service.
Consistent access to timely rides and food delivery, even during peak hours.
Features that prioritize her safety, such as real-time tracking and driver verification.
Key Findings
Our user interviews gave us a deeper look into what shapes the experiences of new and frequent Uber users, revealing the key factors that matter most to them.

Food Ordering
New users tried Uber Eats for promotions or recommendations. While they found the ordering process simple, slow app load times and unclear restaurant reviews were common pain points.
Frequent users opted for Uber Eats for its promotions and ease of reordering past meals. They praised the tracking system but mentioned frustrations with unresponsive drivers and customer support during order delays.

Ride Ordering
New users appreciated the introductory onboarding tutorials and found the sign-up process easy but took time to get accustomed to the different ride options and app layout.
Frequent users value Uber's convenience, availability of vehicle options, and accurate ETA features. However, they expressed concerns about surge pricing and unreliable drivers. Users preferred Uber due to smoother app functionality and more options.


Phase 2:
Think-Aloud Sessions
Tasks Given
To deepen our understanding, we set up think-aloud sessions where participants could walk us through their thought process as they used the app. This allowed us to observe firsthand where they encountered friction and what went smoothly. We conducted in-person observations during which participants were asked to complete tasks while verbalizing their thoughts. These sessions were recorded using both screen and audio capture to analyze the users' interactions with the app and observe their navigation patterns. For data collection, we utilized audio recordings, video footage, and notes.

Task 1: Ordering a Pizza
We asked participants to order a pizza with extra pepperoni from an Italian restaurant, apply any available discounts, and prioritize the shortest ETA. This task helped us understand how users handle customization, locate coupons, and prioritize delivery times.

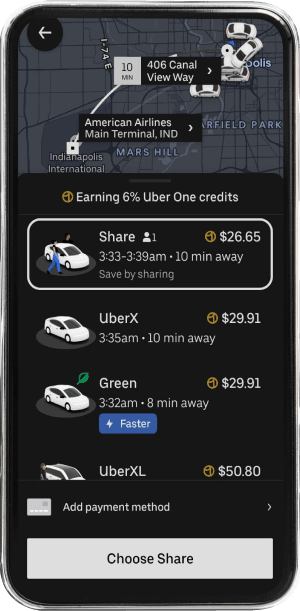
Task 2: Booking a Ride
We asked participants to book an UberXL to an unfamiliar location, with a pickup time set 30 minutes ahead. This task let us understand how users navigate scheduling options and their comfort level with various ride choices.
Analysis Process
After the think-aloud sessions, insights from the observations were gathered from all team members in the FigJam file. Common issues identified were eliminated, and the remaining observed issues were evaluated to analyze recurring challenges. Following a discussion on the criteria for defining success and failure, we calculated the probability of detection for the problems identified by our team, using a set of five raters.
Issues/Problems Observed
The next step was to analyze the interview data. From the data obtained, These were the common usability issues and problems that were faced by participants.

1
2
Common Codes/Themes
We identified common codes and themes to categorize related issues, focusing on aspects like the onboarding experience, ease of use, tracking and safety, technical performance, positive/negative factors, and motivations for continued use. This categorization allowed us to structure the data for more in-depth analysis.
3
Calculating Probability of Detecting Issues and Confidence Interval
Using the common codes/themes, we calculated the probability of detecting issues and established a confidence interval, helping us understand the reliability of our findings and identify areas for improvement.
Probability of Detecting Issues

Confidence Interval
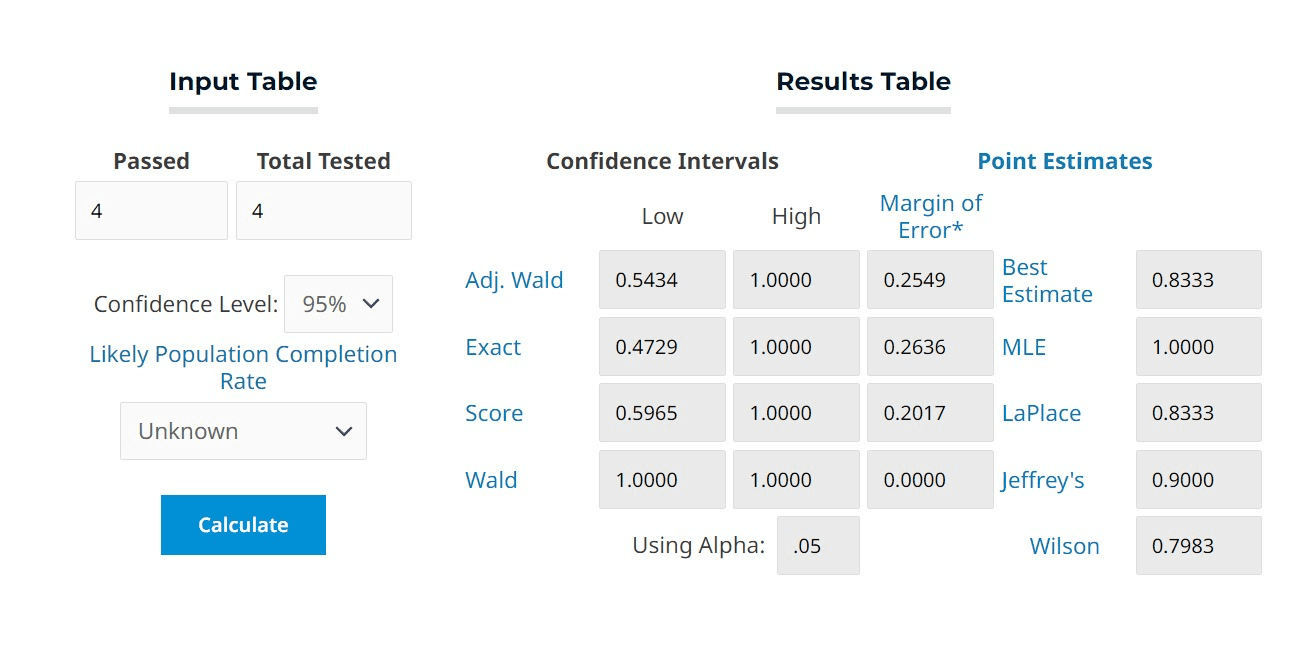
During a think-aloud session 4 out of 4 (100 %) users successfully completed Task 1 and 4 out of 4 (100 %) users successfully completed Task 2.
We can be 95% confident that the actual population completion rate is between 54.34% and 83.33%.
Small Chance the completion rate is below 50%.
Margin of error is high, but if your goal is that at least 50% of users can complete task before next cycle, this provides evidence.

Phase 3:
SUS Assessment
Analysis Process
After completing the tasks, participants filled out a System Usability Scale (SUS) survey to rate their experiences. The SUS included ten statements rated on a 5-point Likert scale, with scores ranging from 1 (strongly disagree) to 5 (strongly agree). Collected data was input into a Google Sheets document, where the SUS scores were calculated by adjusting raw ratings, summing them, and multiplying by 2.5 to produce a final usability score ranging from 0 to 100. Higher scores indicated better-perceived usability. The SUS results provided insights into user perceptions and identified key areas for improving the application experience.

Interpretation
The product scored an average of 76.6 on the SUS, well above the industry benchmark of 68, which points to it being user-friendly and effective in meeting users’ needs.
The 95% confidence interval of 35.0 to 119.0 means we’re quite sure the true average usability score is somewhere within this range. This suggests that the system likely has minimal usability issues overall.
Key Findings
The overall key findings from our evaluation of the Uber app highlight both strengths and areas for improvement:
👍
Ease of Use
Most users found the app intuitive for booking rides and ordering food, with a smooth onboarding experience that helped new users get started easily.
📍
Convenience & Tracking
Users appreciated Uber’s convenience and accurate ride tracking, which contributed to a strong sense of security and trust in the app.
✏
Customization Options
While frequent users valued the variety of vehicle and food options, they found that customizing orders (like adding extra toppings) could be more visible and streamlined.
💰
Pricing Concerns
Surge pricing and overall higher costs compared to competitors were frequent concerns, especially during peak hours.
❓
Unclear CTAs
Confusion around call-to-action button names and the tab-switching experience for Uber and Uber Eats led to usability issues, indicating a need for clearer labeling.
💸
Promotional Discounts
Both new and frequent users valued discounts but sometimes found applying them unclear or overlooked in the checkout process.
🛠
Technical Performance
Users reported reliable technical performance, with minimal issues in app speed or payment processing.
Recommendations
Helping users quickly find relevant options especially while looking for cuisines like Italian by adding search filters that would better categorize the restaurants.
Simplifying customization for adding extra topping by making it more visible to the users.
Having clear automatic prompts for users to avail promotional discounts during checkout, so they don't forget.
Designing the CTA buttons to be more intuitive and clear for users to understand.
Rather than having the tab-switching experience for Uber & Uber-Eats, implementing a two-step method would help in error prevention.
Making sure that the expired coupons are disabled. And clearly mentioning which discount coupons were automatically applied and why.
Make it easier to find & select the fastest arrival time by making the interface simple and letting users sort time by ETA.
Next Steps
Enhanced Onboarding
Create clear, concise onboarding tutorials and help resources that guide users through the app’s features, reducing confusion.
Iterative Prototyping
Develop low-fidelity prototypes based on the identified issues and insights, allowing users to interact with new designs and provide feedback.
User Feedback Loop
Establish ongoing feedback mechanisms, such as surveys or in-app prompts, to gather user opinions on new features and changes in real-time.

Good things happen
when you say hello!
Feel free to connect with me at:
shraddhapk2002@gmail.com
